Getting Started
This is a short tutorial to get started with atoti and learn the very basics. We encourage you to copy this notebook in your workspace, replay it and even modify it.
Session and imports
A session holds a connection to a Java subprocess where all the data is stored and the computation takes place.
Start by importing atoti and creating your session:
[1]:
import atoti as tt

session = tt.create_session()
Welcome to atoti 0.4.0!

By using this community edition, you agree with the license available at https://www.atoti.io/eula.
Browse the official documentation at https://docs.atoti.io.
Join the community at https://www.atoti.io/register.

You can hide this message by setting the ATOTI_HIDE_EULA_MESSAGE environment variable to True.
Data sources and stores
Several data sources (CSV, Parquet, pandas…) are available to load data into atoti stores. They are all described in the “Data sources” part of the tutorial, this Getting started will only use CSV files.
When loading a source into a store you must specifiy one or more key columns.
It’s advised to do data cleaning before loading the data into a store (for example in pandas or directly in your CSV file).
[2]:
first_store = session.read_csv("data/example.csv", keys=["ID"], store_name="First")
You can retrieve the first rows of the store with head:
[3]:
first_store.head()
[3]:
| Date | Continent | Country | City | Color | Quantity | Price | |
|---|---|---|---|---|---|---|---|
| ID | |||||||
| 1 | 2019-01-01 | Europe | France | Paris | red | 1000.0 | 500.0 |
| 2 | 2019-01-02 | Europe | France | Lyon | red | 2000.0 | 400.0 |
| 3 | 2019-01-05 | Europe | France | Paris | blue | 3000.0 | 420.0 |
| 4 | 2018-01-01 | Europe | France | Bordeaux | blue | 1500.0 | 480.0 |
| 5 | 2019-01-01 | Europe | UK | London | green | 3000.0 | 460.0 |
You can view a store’s columns with columns
[4]:
first_store.columns
[4]:
['ID', 'Date', 'Continent', 'Country', 'City', 'Color', 'Quantity', 'Price']
References
A reference is a link between 2 stores.
You can specify the column mapping of the reference or use the default one which are the columns with the same name in your stores:
[5]:
capitals_store = session.read_csv(
    "data/capitals.csv", keys=["Country name"], store_name="Capitals"
)
[6]:
capitals_store.head()
[6]:
| Capital | |
|---|---|
| Country name | |
| France | Paris |
| UK | London |
| China | Beijing |
| India | Dehli |
[7]:
first_store.join(capitals_store, mapping={"Country": "Country name"})
Cubes
A cube can be defined on a store.
All the non-numerical columns of the store and the referenced stores will be converted to single level dimensions. Default measures will be created from numerical columns.
[8]:
cube = session.create_cube(first_store, "FirstCube")
[9]:
m = cube.measures
cube.query()
[9]:
| Price.MEAN | Price.SUM | Quantity.MEAN | Quantity.SUM | contributors.COUNT | |
|---|---|---|---|---|---|
| 0 | 428.0 | 4280.0 | 2270.0 | 22700.0 | 10 |
[10]:
lvl = cube.levels
h = cube.hierarchies
h
[10]:
- Dimensions
- Hierarchies
- Capital
- Capital
- City
- City
- Color
- Color
- Continent
- Continent
- Country
- Country
- Date
- Date
- ID
- ID
- Capital
- Hierarchies
Measures
New custom measures can be added to your cube.
You will learn more about what is possible in the measure tutorial.
[11]:
m["Half quantity"] = tt.agg.sum(first_store["Quantity"]) / 2
cube.query(m["Half quantity"])
[11]:
| Half quantity | |
|---|---|
| 0 | 11350.0 |
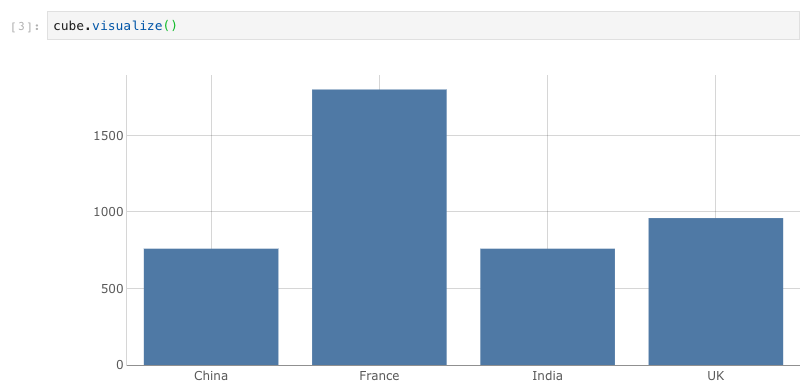
Interactive visualization
There are 2 ways to do interactive dataviz: with the JupyterLab extension and with the atoti application.
JupyterLab extension
When our JupyterLab extension is installed, you can build interactive widgets right there in your notebook:
atoti Application
This is our dashboarding suite. Its URL can be retrieved from the session:
[12]:
session.url
[12]:
'http://localhost:32889'